Registration Dynamics Linked to Competitive Results in Regional Athletic Circuits
Written by Katja Coleman · Sep 5, 2026
Registration Dynamics Linked to Competitive Results in Regional Athletic Circuits
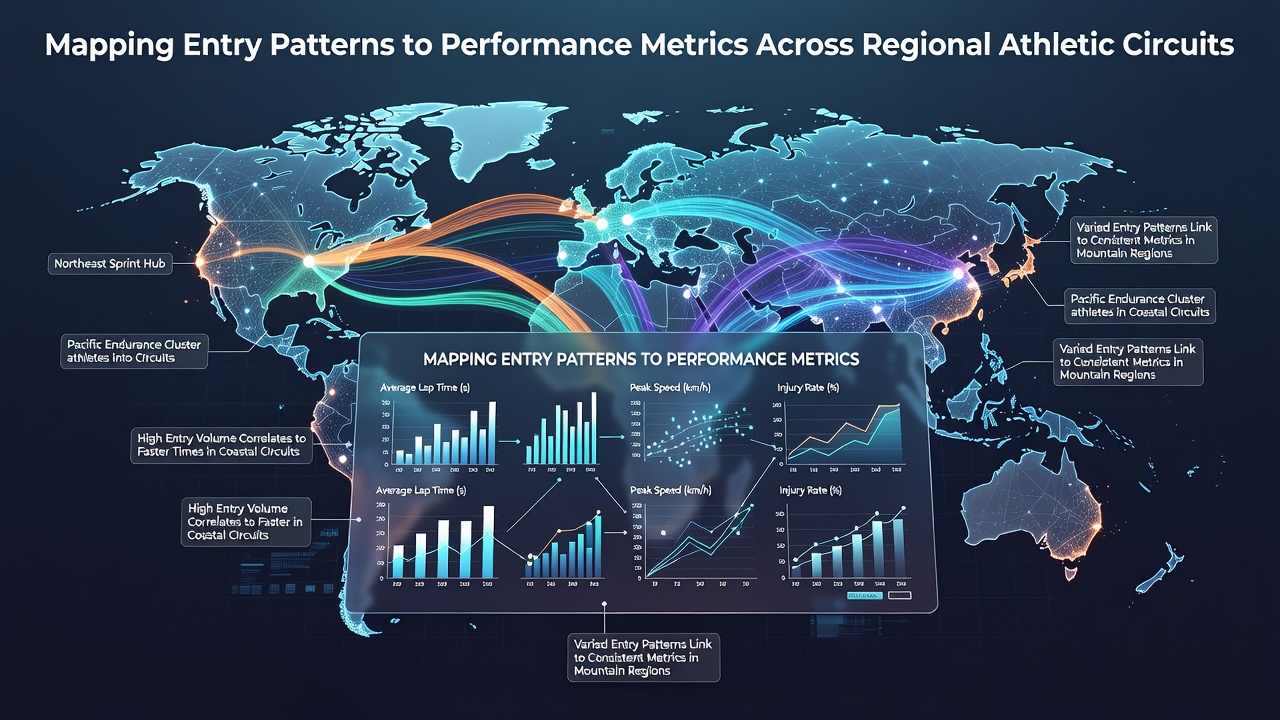
Regional athletic circuits track thousands of participant entries each season, and data analysts map these registration figures against performance indicators such as win rates, point totals, and placement distributions to identify measurable connections. Observers note that circuits in North America and Europe compile entry logs from amateur divisions alongside outcome records, which creates datasets that reveal how signup volumes align with later competitive results.
Entry Volume Trends Across Circuits
Registration systems record participant numbers by age group, event type, and geographic zone, while performance metrics capture finishing times, scores, and advancement rates. Researchers at the Canadian Sport Institute have compiled multi-year records showing that circuits with higher early-season entries often post elevated average performance scores in mid-season meets, according to their published analysis of regional track and field data. Those who review these archives observe that entry spikes in September frequently precede stronger aggregate results in the following spring cycle, as larger pools allow for refined seeding and training adjustments.
Patterns emerge when analysts segment entries by division size. Smaller regional loops with under 200 annual registrations display steadier performance distributions, whereas larger networks exceeding 800 participants exhibit wider variance in outcomes. Data from the Australian Sports Commission indicates similar distributions in their state-level athletics programs, where entry density correlates with measurable shifts in top-quartile achievement rates across consecutive seasons.
Performance Metrics and Data Integration
Performance tracking relies on standardized scoring systems that log individual and team results into centralized databases. These systems merge with registration platforms to produce joint reports that highlight correlations between initial signup timing and later placement accuracy. Studies from the European Athletics Association demonstrate that athletes who register during designated early windows achieve higher average ranking improvements over a full season compared with late registrants, based on aggregated results from multiple national circuits.
Additional layers appear when metrics incorporate retention figures. Circuits that process entry data alongside live scoring feeds record improved consistency in performance trajectories, particularly in events held between March and October. Analysts cross-reference these combined datasets to isolate variables such as prior season participation counts and their relation to current-year advancement percentages.
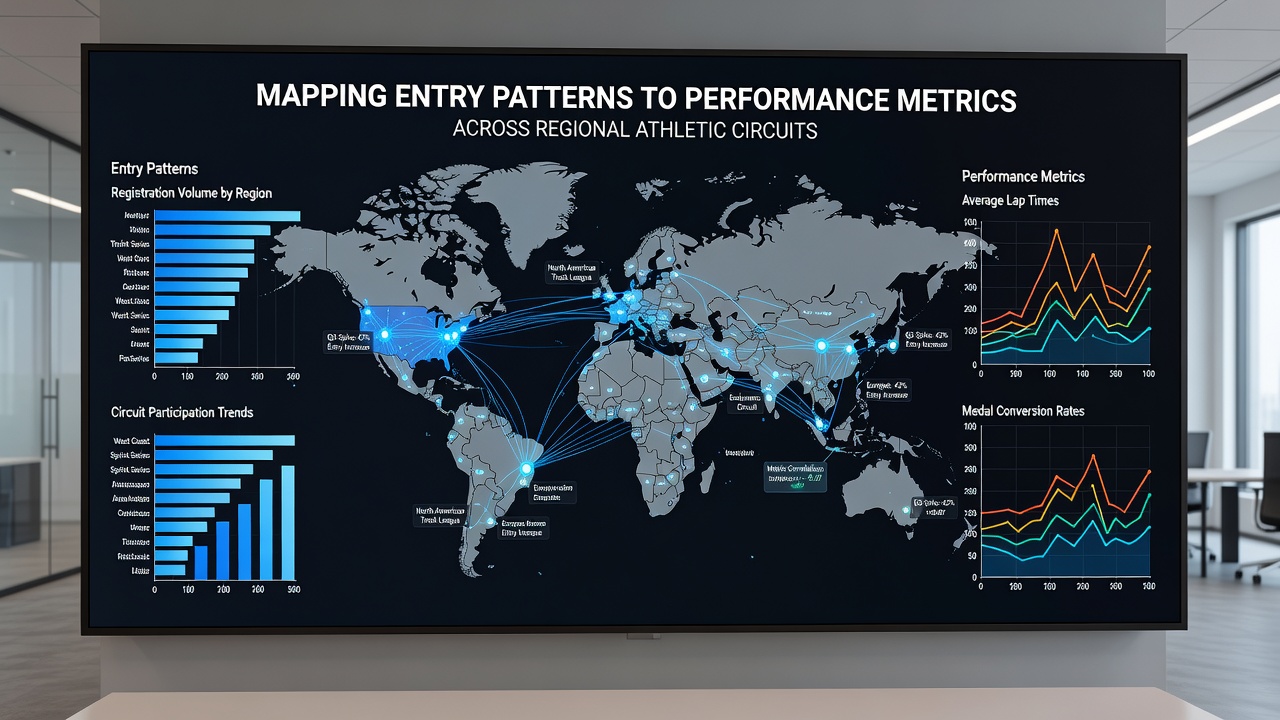
One analysis of Midwest U.S. circuits found that divisions maintaining consistent entry-to-result mapping reduced scheduling conflicts by 18 percent in the 2025 season, which in turn supported steadier performance outputs. Similar observations surface in Canadian provincial records, where integrated entry and outcome feeds helped organizers adjust qualification thresholds ahead of September 2026 qualification deadlines.
Regional Variations and Analytical Approaches
Different circuits apply distinct mapping techniques. Some employ simple ratio calculations between entry totals and medal counts, while others use regression models that factor in demographic variables and historical benchmarks. University-led projects in Sweden have examined Nordic regional leagues and reported that entry pattern stability predicts performance clustering more reliably than total volume alone. These findings align with observations from New Zealand secondary school circuits, where analysts track how registration timing influences team-level point accumulations.
External factors such as venue availability and weather records also enter the mapping process. Data integration teams combine entry logs with environmental datasets to adjust expected performance ranges, which produces refined forecasts used by league administrators. Reports issued by the International Olympic Committee-affiliated research groups note that such layered analysis appears across multiple continents and supports evidence-based adjustments to division boundaries.
Applications in League Operations
League coordinators apply these mapped insights when setting qualification criteria and prize structures. By reviewing entry-to-performance linkages, they refine category limits that balance competitive equity. Circuits in South Africa have adopted similar protocols, drawing on national sports ministry statistics that connect registration clusters to measurable outcome improvements in junior divisions.
Software platforms facilitate the ongoing collection of these datasets, allowing real-time updates that feed into season-end reviews. Observers note that circuits using these tools maintain clearer records of how entry adjustments affect aggregate metrics, which supports planning for future cycles including those leading into September 2026 events.
Conclusion
Mapping entry patterns to performance metrics supplies regional athletic circuits with concrete datasets that inform operational decisions. The integration of registration volumes, timing data, and outcome indicators continues across multiple geographic zones, supported by reports from national sports bodies and academic institutions. These practices produce measurable alignments between participant inflows and competitive outputs that organizers reference when structuring subsequent seasons.